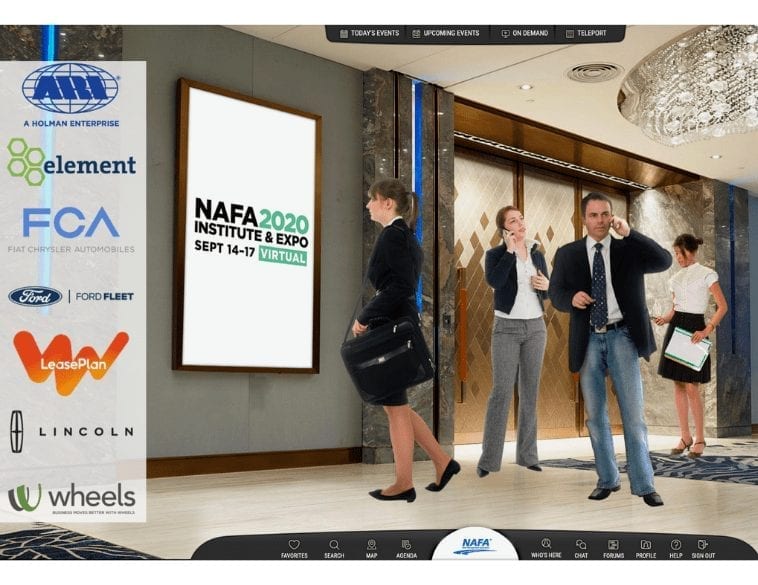
Like most events this year, NAFA’s 2020 I&E has gone virtual. The online event kicked off on Sept. 14th with all participants logging on from their homes and offices.
One of the sessions that caught our attention on opening day was hosted by NETS (Network of Employers for Traffic Safety). The research conducted by NETS paints a clear picture of the fleet policies that make the biggest difference to the overall safety of today’s fleets.
Their analysis is based on questionnaires sent out to dozens of fleets, asking about their policies and practices. Employers are also asked to report key metrics, including collisions per million miles traveled (CPMM), the percentage of their fleet involved in a collision, and the number of injuries per million miles traveled (IPMM).
Not all metrics apply equally in all fleet situations. For example, if a fleet spends all of its time in the downtown core of a big city, then CPMM may not be as useful a metric as the percentage of the fleet that was involved in a collision.
Speaking during the NETS session, Jonathon Vivoda, Assistant Professor at Miami University focused on the latest available statistics, which were compiled from data collected in 2018. According to Vivoda, the average CPMM was 5.09 for the 72 companies who participated in the survey in 2018. In addition, the average percentage of fleet involved in a collision was 8.67 for the 72 participants.
Making a difference
When looking at CPMM, it’s clear that certain fleet policies make a big difference statistically. The most significant difference was seen with fleets that have a fatigue mitigation policy in place. With heavy vehicle fleets, for example, when a company’s policy required driving with a partner, CPMM numbers improved by an average of 6.86%.
The next biggest contributor to heavy vehicle collision stats was the restriction of nighttime driving. Fleets that had a night driving policy in place saw a drop of 6.71% in collisions. Light vehicle fleets saw similar benefits when implementing restrictions on night driving (4.4 % improvement).
According to Vivoda, fleets with policies in place that address driving while fatigued had the best CPMM numbers overall. Likewise, fleets that had in place a policy that promotes competition amongst drivers vying for first place as the “safest” within the organization, also had statistically better CPMM numbers.
In addition, fleets with in-vehicle monitoring systems had better crash metrics, as did those with mobile phone limiting technologies and driver training programs. A strong collision review process was also found to make a big difference.
Fleet policies to avoid
NETS’ research also painted a clear picture of policies that fleets would want to avoid. For example, some organizations will check to see whether a driver was using their phone when they got into a collision, but then their policy lacks serious consequences that would make the driver think twice before using their phone while driving in the first place. Vivoda said these fleets had higher collision rates.
Another key mistake made by multinational organizations is having a mobile phone policy, but then leaving the details of that policy up to each individual country or company unit. “That’s a bad idea, “Vivoda explained. “It’s generally related to worse crash metrics.”
Vivoda recommended implementing a strong fleet policy to make sure that phone records are checked after a collision. And the more corporate executives within an organization support road safety, the more seriously fleet drivers will take safety overall.
Since all fleets are different, Vivoda advises fleet managers to take a measured approach to improving their own safety statistics. “Everything is going to be different for each company,” he concluded. “So look for things that are changeable and practicable for you to change in your company. The numbers tell us one thing, but you understand how difficult or how easy it might be to change a certain thing. So look for that low-hanging fruit when thinking about what changes you can make.”


